A grade is just a number until you can defend it. So this is the full picture of how FLARE turns a touchdown into A+ through F — what we measure, how the weights work, what we do when MSFS doesn’t give us enough data, and why the scoring is calibrated against real airline ops standards instead of “did the wheels stay on the ground.”
The composite
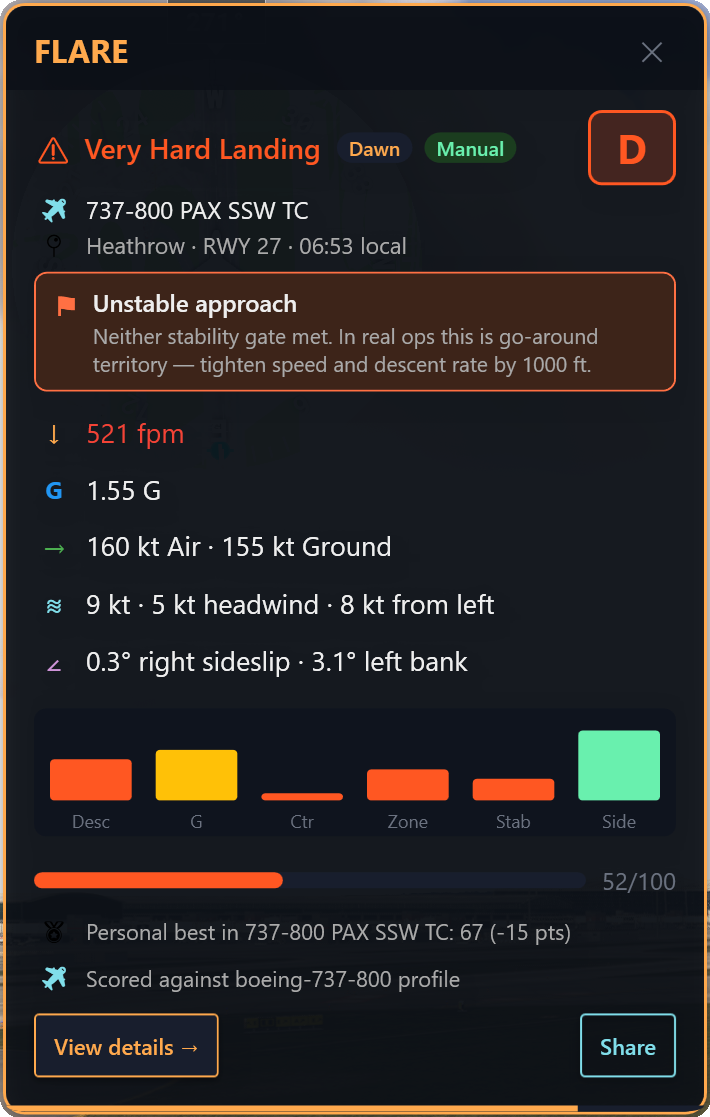
Every landing is graded as a weighted sum of six criteria. Each criterion produces a 0–100 score; the composite is the weighted average; the grade is bucketed off the composite.
| Criterion | Weight | What it measures |
|---|---|---|
| Descent rate | 30% | Touchdown vertical speed (fpm) |
| G-force | 20% | Peak G-load on touchdown |
| Centerline | 15% | Lateral offset from runway centerline at touchdown |
| Touchdown zone | 15% | Distance from runway threshold to touchdown point |
| Approach stability | 10% | Pass/fail gates at 500 ft and 300 ft AGL |
| Sideslip + bank | 10% | Asymmetric landing-gear loading at touchdown |
Plus a bounce penalty subtracted off the composite if you hop the airframe more than once. And — for cataloged aircraft — a tail-strike penalty if your touchdown pitch crossed the per-airframe threshold (the 757-300 hits at 7.5°, the A320 at 13.5°, the 737-800 at 9.5°).
The composite maps to a letter grade as follows:
| Composite | Grade | Read |
|---|---|---|
| 95–100 | A+ | Airliner-soft, on centerline, in zone. |
| 85–94 | A | Excellent execution. |
| 75–84 | B | Solid landing, minor blemish on one axis. |
| 65–74 | C | Workable, but the debrief has notes. |
| 50–64 | D | Hard, off-centerline, or both. |
| < 50 | F | Real airline maintenance would write this up. |
Two things the weights aren’t doing
They aren’t averaging “how it looked”
The weights are calibrated against where the actual risk lives in a landing. Descent rate is 30% because vertical speed is the single best predictor of structural damage — Boeing’s hard-landing inspection threshold for the 737 is ~360 fpm; cross that and maintenance pulls the aircraft. G-force is 20% because peak G is what bends gear and bulkheads. Centerline + TD-zone are 15% each because lateral and longitudinal positioning together determine runway-excursion risk — the most common loss-of-control accident type during landing.
Approach stability and sideslip are 10% each because they’re upstream of the touchdown itself. An unstable approach produces a bad touchdown more often than not, but a stable approach doesn’t guarantee a good touchdown. You can fly a textbook stabilized approach and still flare too late. So we credit both — but the touchdown moment matters more.
They aren’t trying to flatter you
A 737-800 hand-flown to a 250 fpm touchdown on centerline at the 1,000-ft markers is genuinely an A+ landing in real ops. A 50-fpm “butter” landing 2,000 ft past the threshold, slightly off-center, is not — it’s a long landing that ate stopping distance and put the aircraft at risk of a runway excursion. FLARE’s composite will tell you that. The number on the popup is meant to be a useful debrief, not a participation trophy.
Per-aircraft thresholds
A Cessna 172 isn’t a Boeing 737. The 172 lands at 60 KIAS into the first 200 m of runway; the 737 lands at 145 KIAS and aims for 300–600 m. So FLARE applies a per-airframe profile to the thresholds.
Per the catalog, FLARE recognizes hundreds of airframes across 25 categories — from the Cessna 152 through the A380 — and each profile sets its own:
- Descent rate curve — 200 fpm “firm” is great for a Cessna and concerning for an A320. The curve maps fpm to the 100/85/60/35 boundaries differently per airframe.
- G-force curve — light aircraft tolerate higher transient G than transport-category, which have to protect a longer fuselage and heavier load.
- Touchdown-zone window — a 152’s TDZ ideal is 50–200 m; a 737’s is 240–600 m; an A380’s is wider still.
- Tail-strike pitch — the unique-per-airframe maximum safe touchdown pitch.
- Vref + stability gates — the speed target for the stability check is the actual aircraft’s Vref, not a one-size-fits-all 140 kt.
When MSFS reports an aircraft we don’t recognize (rare — payware mods, freeware mods, livery-only mods), FLARE falls back to a universal-aircraft profile and flags the landing as “scored against universal fallback” on the detail page. You’re still graded — just against a less specific yardstick.
What happens when MSFS doesn’t tell us everything
This is the part most flight-sim landing trackers get wrong, and the part FLARE specifically fixed in v1.2.
For centerline and touchdown-zone scoring to work, FLARE needs three pieces of runway data: the threshold coordinates, the heading, and the length. MSFS publishes these via the ATC RUNWAY SimVars — but only when ATC has actually assigned you a runway. Free-flight starts, hand-flown approaches without a flight plan, third-party scenery that doesn’t expose facility data, fictional sim airports — any of these can leave FLARE with no runway from MSFS.
Pre-v1.2, the scoring engine awarded a default 100/100 on both centerline and touchdown zone when this happened. The rationale was “don’t penalize the pilot for missing data” — which sounds reasonable until you realize it silently inflated every “no-runway-data” landing by 30%. A hard landing way off-centerline in third-party scenery would grade out at C or D when the real grade was F.
So v1.2 introduced a three-tier fallback:
- MSFS ATC — the happy path. When MSFS shares the runway, use it.
- GPS lookup against bundled navdata — when MSFS doesn’t, FLARE looks up the runway by your touchdown coordinates against a bundled OurAirports SQLite database (~70,000 airports, ~50,000 runway ends, CC0 public-domain data shipped inside the installer). Works offline. Gives you the parallel-runway suffix (15L vs 15R) as a side benefit.
- Not detected — when both miss (fictional MSFS sceneries, genuine off-airport landings), centerline and touchdown zone are excluded from the weighted total — NaN-skipped, with the remaining four criteria renormalized to /100. You’re graded only on what was actually measurable.
The math for tier 3 is just weighted-average renormalization. If centerline + TD-zone are missing, the remaining 70% (descent + G + stability + sideslip) gets re-scaled to occupy 100%. The popup shows a “Runway not detected” chip so you know your grade was computed against four criteria instead of six.
The net result: an honest grade beats an inflated one. A grade you can argue with on the debrief table is more useful than a grade you can’t trust.
The stability gates
Stability scoring is the only criterion that’s pass/fail at two specific points rather than continuous. Two gates: one as you descend through 500 ft AGL, one at 300 ft AGL. Each gate checks four criteria in parallel:
- On speed — IAS within ±10% of Vref (or ±10 kt, whichever is larger).
- Bank under control — bank angle < 5°.
- Stable rate of descent — vertical speed within ±200 fpm of the running approach average.
- On glideslope — flight-path angle within ±1° (jets) or ±1.5° (GA / tailwheel) of the standard 3°.
All four must be true at a gate for that gate to count as “stable.” Both gates need to be stable for the full 100. Hit only the 300-ft gate, you get 70. Miss both, you get 0 on this criterion.
Why 500 and 300? Those are real-world stabilized-approach thresholds — most airline SOPs require stabilization by 1,000 ft AGL in IMC and 500 ft AGL in VMC. We use 500 as the upper gate (the practical airline minimum) and 300 as the inner gate (final commitment point — go-around-or-land decision in real ops).
Why this is harder than it sounds
Building a scoring engine isn’t really an engineering problem — it’s a calibration problem. The hard part is deciding where to put each threshold. Too lenient and an A+ becomes meaningless. Too strict and even good landings grade out as B. You have to:
- Anchor thresholds to real standards (FAA Practical Test Standards, airline FOM hard-landing thresholds, FCOM Vref tolerances).
- Account for the sim’s measurement limitations (SimConnect samples at 30–60 fps, so touchdown FPM is ±5–10 fpm off the instantaneous true value — which is partly why we round before scoring).
- Differentiate aircraft thoughtfully (a 757 isn’t a 737, an A330 isn’t an A320).
- Test against actual landings across all 25 categories, not just the airliners.
The result is a grade you can trust to differentiate good flying from bad, that respects what the underlying simulator can actually measure, and that doesn’t reward you for what FLARE can’t see.
If you want the full per-component reference — the score curves, the per-aircraft tables, the exact formulas — it’s all on the scoring methodology page in the help docs. And if you want FLARE on your PC, the pricing is exactly one screen.